What fifteen years of sentencing memos, one very large spreadsheet, and a list of my own biases taught me about asking honest questions of legal data.
For more than fifteen years I wrote sentencing memoranda in federal criminal cases, which is a peculiar genre of legal writing in which you try to persuade a judge that the person standing beside you is more than the worst thing they have done, and that the number on the guidelines worksheet does not tell the whole story. I got reasonably good at it. I also developed, as anyone does after that many years in the same courtrooms, a large and confident collection of opinions about how sentencing actually works, which judges are hard, which charges are punished out of proportion, and who tends to get the benefit of the doubt.
This fall, as part of a graduate data science program at Northwestern, I finally had the chance to test some of those opinions against something larger than my own memory. The Cook County State's Attorney's Office publishes its sentencing data on the county's open data portal, and the version I downloaded ran to 305,884 rows and 41 columns, covering sentences from 2011 through late 2024. Cook County was a jurisdiction where I had never practiced, which meant I knew the law but none of the local folklore, and that turned out to be a useful kind of ignorance.
I should say plainly what this was and was not. The assignment was an exercise in learning how to prepare, review, and analyze a large and genuinely messy dataset, the kind with impossible dates, inconsistent categories, and sentence lengths stored as text, and most of my hours went to cleaning rather than concluding. It was never meant to be a study of Cook County's courts, and nothing below should be read as a grand pronouncement about them. What it gave me instead was a set of lessons about method that I suspect will outlast any particular finding.
Two things happened before I produced a single chart that I think matter more than any of the charts themselves, and both apply well beyond criminal sentencing.
Deciding what to count
The first surprise was structural. Each row in the dataset is a charge, not a person and not a case. One person in one case can carry several charges, and one charge can carry more than one sentence if, for example, probation is revoked and the court imposes something new. Before you can ask whether anything is common or rare, harsh or lenient, you have to decide what you are counting, and the dataset does not make that decision for you.
That sounds like a technicality, and in a sense it is, but it is the kind of technicality that quietly determines your conclusions. Counting charges tells you which offenses drive the volume of sentencing, which is what an office needs to know about where its caseload and exposure sit. Counting people avoids giving extra weight to someone who was charged with eleven counts arising from one bad afternoon, and it matches how a mitigation team actually takes on clients, one human being at a time. Neither choice is wrong. They answer different questions, and if you do not choose deliberately, the shape of the spreadsheet will choose for you.
I started out intending to count people where I could. As I worked through the data, I shifted my main analysis toward charges and toward incarceration of any kind rather than prison alone, because that was where the data was cleanest and where the questions I cared about could be answered honestly. I flagged the shift in my notes as I made it, since a change in the unit of measurement halfway through a project is exactly the kind of thing that a reader, or a future version of yourself, deserves to be told about.
By the end, the question had grown rather than resolved. A strategy aimed at reducing incarceration can try to affect the greatest number of charges, or it can try to reduce the greatest number of years people spend in custody, and those two goals point at very different cases. Narcotics and unlawful use of a weapon charges together accounted for more than 40 percent of all incarcerated charges in the data, with median state prison terms of around 30 and 36 months. Homicide, by contrast, ended in incarceration 98.4 percent of the time with a median term of 336 months, but involved far fewer charges. Whether a defender's office should put its scarce mitigation dollars toward the many or the long is a values question, and no amount of pandas will answer it for you.
I spend my days now managing data and innovation at a civil legal aid organization, and this problem is not unique to criminal court. Every legal organization that reports to a funder, a board, or a managing partner is counting something, whether cases opened, clients served, matters closed, or hours billed, and each of those choices flatters some work and hides other work. When I built a workflow that matches incoming legal aid cases to the grants that can fund them, the hardest part was not the technology. It was agreeing on what a "case" was for each funder, because the answer changed from grant to grant, and the matching only became useful once we had settled that. The unit of measurement is where your values first enter the data, usually long before anyone builds a dashboard, and usually without anyone noticing that a decision was made at all.
Writing down the hunch
The second thing I did before the analysis was less technical and, I suspect, more unusual. I wrote down what I expected to find.
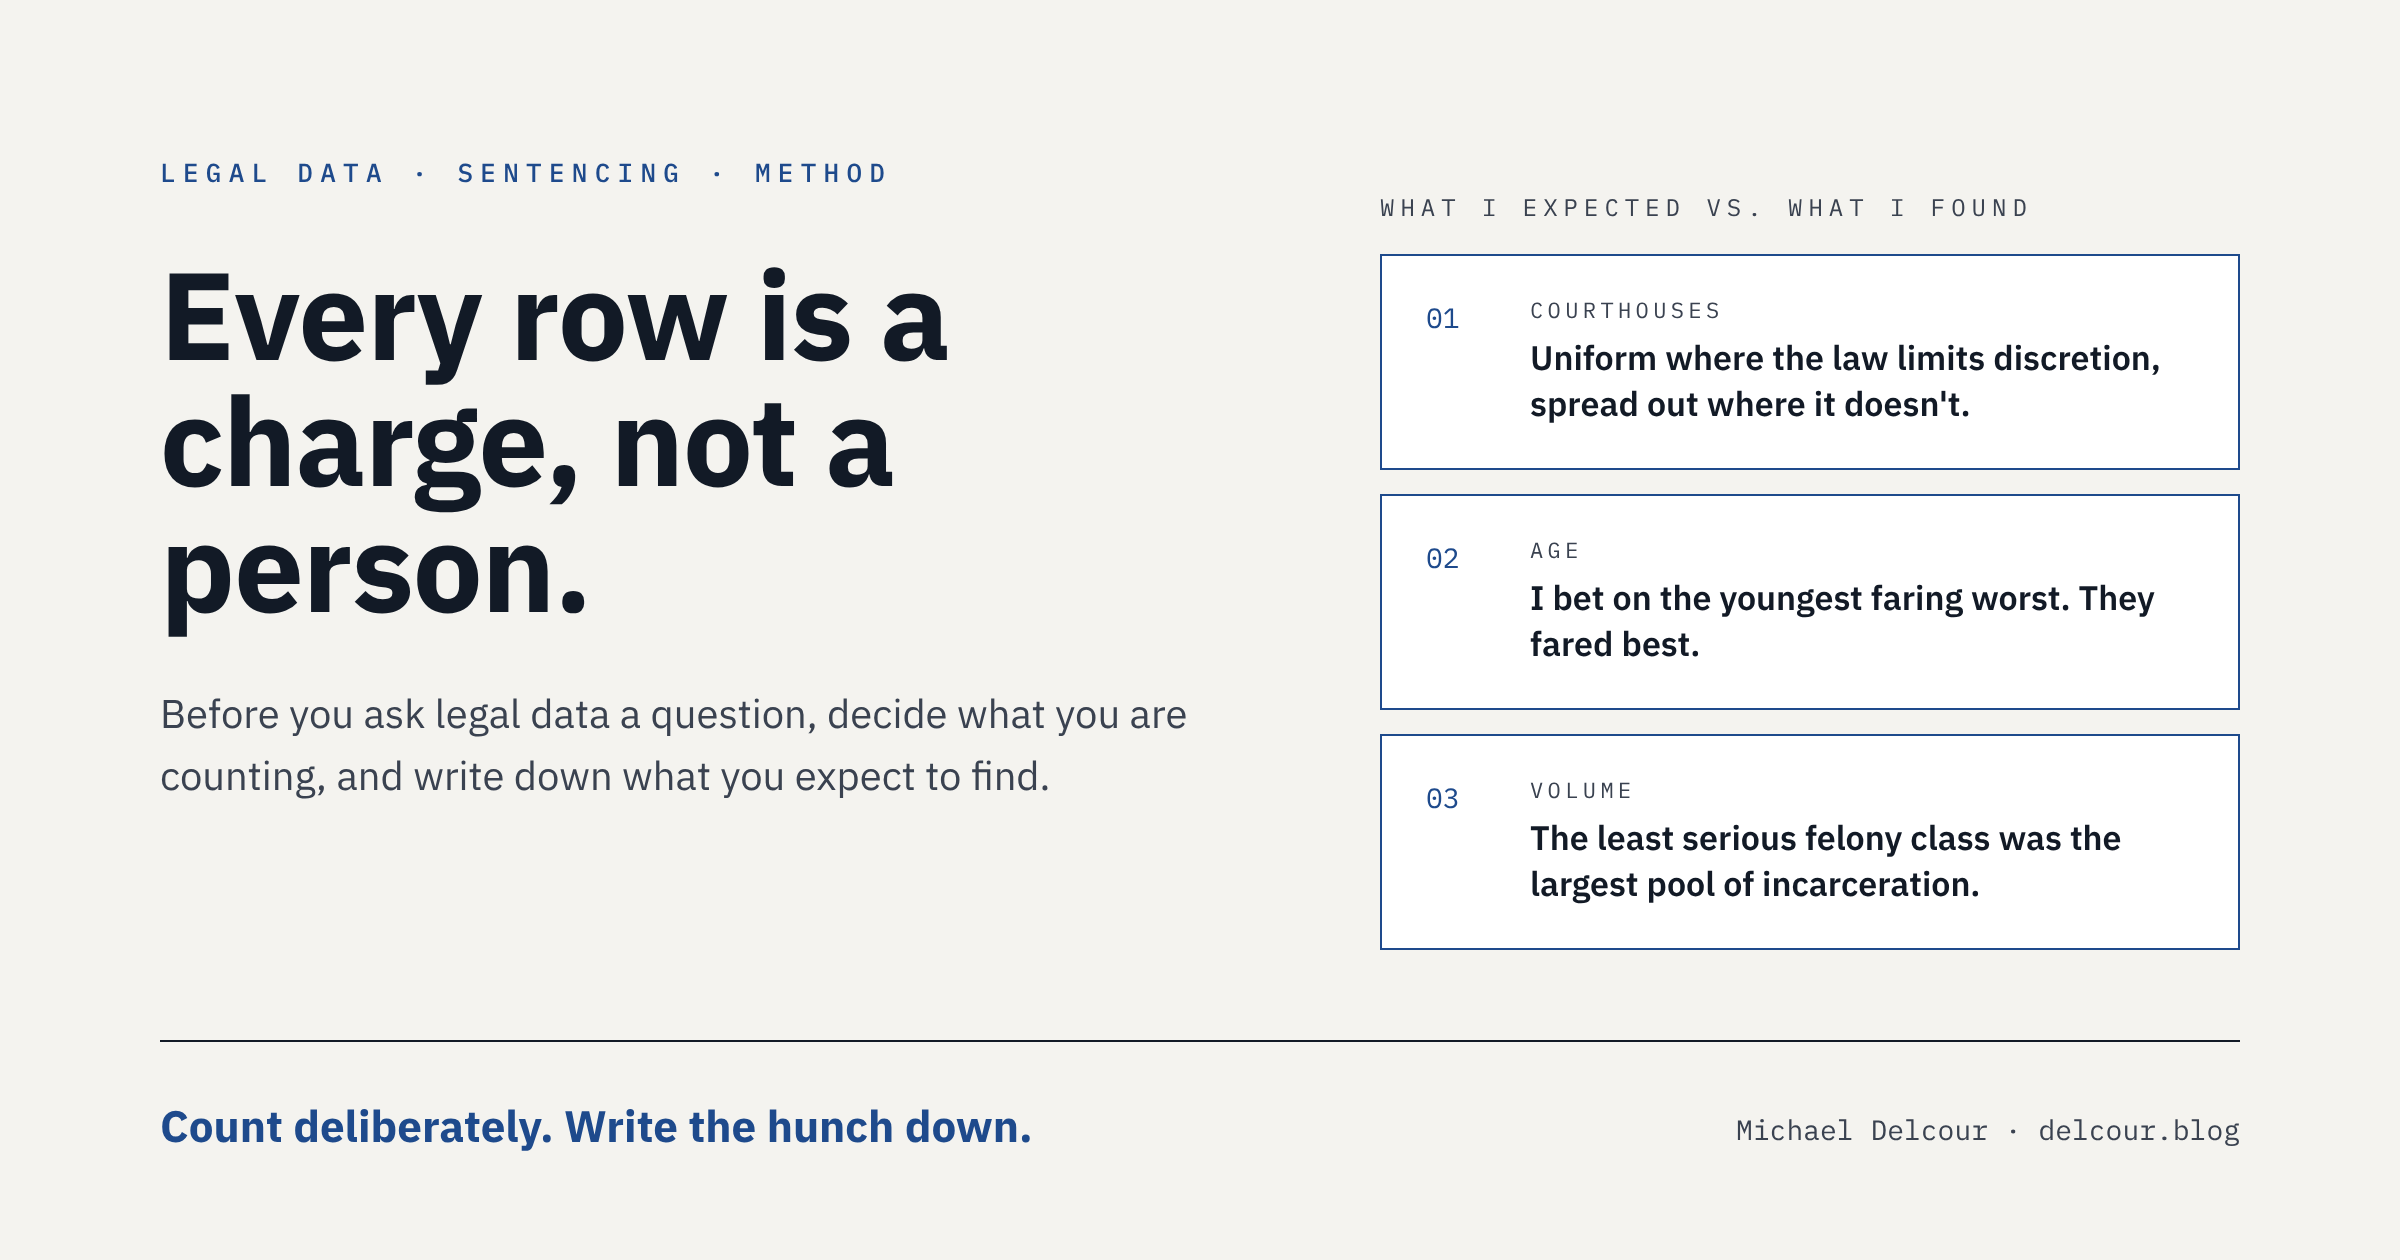
My predictions were not subtle, and I did not try to dress them up. Given a career spent defending indigent and underserved people, I expected the data to show harsher sentences for men, and especially for younger men. I expected drug offenses to be punished more severely than other nonviolent crimes. And I predicted that the county's courthouses would sentence fairly uniformly, because in my experience judges are often cut from similar cloth, while I also expected less consistency within felony classes than in the federal system, which runs on more structured guidelines than Illinois does.
Then I went and looked, and the data was polite enough to tell me I was partly right and partly wrong, which is the most useful thing data can ever tell anyone.
I was right that, within the same offense and felony class, men were incarcerated more often. For Class 4 narcotics charges, the largest single combination in the data, men were incarcerated 53.1 percent of the time compared with 27.0 percent for women. The dataset contains no criminal history field, which in practice matters enormously and can make a Class 4 drug charge ineligible for probation, so a gap like that describes outcomes rather than proves causes.
I was wrong about age. I expected the youngest defendants to fare worst, and instead people under 25 had the lowest incarceration rate of any age group, at 37.7 percent. I suspect the missing criminal histories explain some of it, since younger people have had less time to accumulate one, but either way my professional experience came from a different court with different charges, and the data had no interest in my experience.
The courthouse prediction was the most interesting, because it was neither confirmed nor refuted so much as complicated. For Class 2 weapons charges, incarceration rates ran between 94 and 98 percent at every major courthouse, which is about as uniform as human institutions get. For Class 4 narcotics charges, the rate ranged from 24.5 percent in Rolling Meadows to 54.8 percent at 26th Street. And no courthouse was consistently the harshest across the board. Where the law leaves judges little discretion, outcomes converged; where it leaves room, they spread out. The folklore about hard courthouses, at least in this data, turned out to be a story about discretion rather than geography.
Volume, rather than severity, drove most of the incarceration. Class 4 felonies, the least serious tier, made up roughly 40 percent of all sentenced charges and still ended in incarceration about half the time, which made them the largest pool of incarceration in the dataset. The ten largest offense categories accounted for about 74 percent of all incarcerated charges. If you want to change the numbers, the arithmetic says to look first at the ordinary cases rather than the headline ones.
Why the hunch belongs on paper
Lawyers are trained to build a theory of the case early and then marshal evidence for it, which is an excellent way to win an argument and a terrible way to learn something. Without a written record of what I expected, I am fairly sure I would have looked at the age results and told myself I had suspected something like that all along. Memory is a generous editor, and it is especially generous to its owner.
The same discipline matters more, not less, now that so much legal analysis runs through AI tools. A model will cheerfully help you find support for whatever you seem to believe, and it will do so faster and more fluently than any associate. Writing down your hunch before you open the data, or before you open the chat window, is a cheap and old-fashioned guard against hearing only what you hoped to hear. It costs a paragraph and it buys you the ability to be honestly surprised.
What the spreadsheet cannot tell you
None of this produces a policy recommendation, and I would distrust anyone who claimed otherwise from a single descriptive analysis, least of all one written for a class. The data cannot see criminal history, plea negotiations, the quality of counsel, or the hundred small facts that make one Class 4 case nothing like the next. What it can do is tell an organization with limited money where to start looking, which is more than most organizations get, and then leave the rest to people who know what the numbers leave out.
That, more than any single finding, is what I want to carry into the next stage of my career. Legal technology is moving quickly toward systems that count, sort, summarize, and recommend at a scale none of us could manage by hand, and every one of those systems rests on a decision about what to count and an assumption about what it will find. The most valuable thing a lawyer who builds things can do is make both of those visible, ideally before anyone starts arguing about the conclusions.
Fifteen years of sentencing memos taught me that every defendant is more than the worst row in their file. A quarter with 285,968 cleaned rows taught me that the file was never organized around the defendant to begin with, and that it pays to notice.
Sources
- Cook County State's Attorney's Office, Sentencing Data, Cook County Open Data Portal: datacatalog.cookcountyil.gov/d/tg8v-tm6u (downloaded October 10, 2026; the office stopped updating the dataset on December 30, 2024)
- Illinois sentencing classes and ranges: 730 ILCS 5/5-4.5
- All figures are from my own exploratory analysis of the dataset for MSDS 430 at Northwestern University, after cleaning (285,968 charge rows). Incarceration includes state prison, county jail, boot camp, periodic imprisonment, and home confinement.